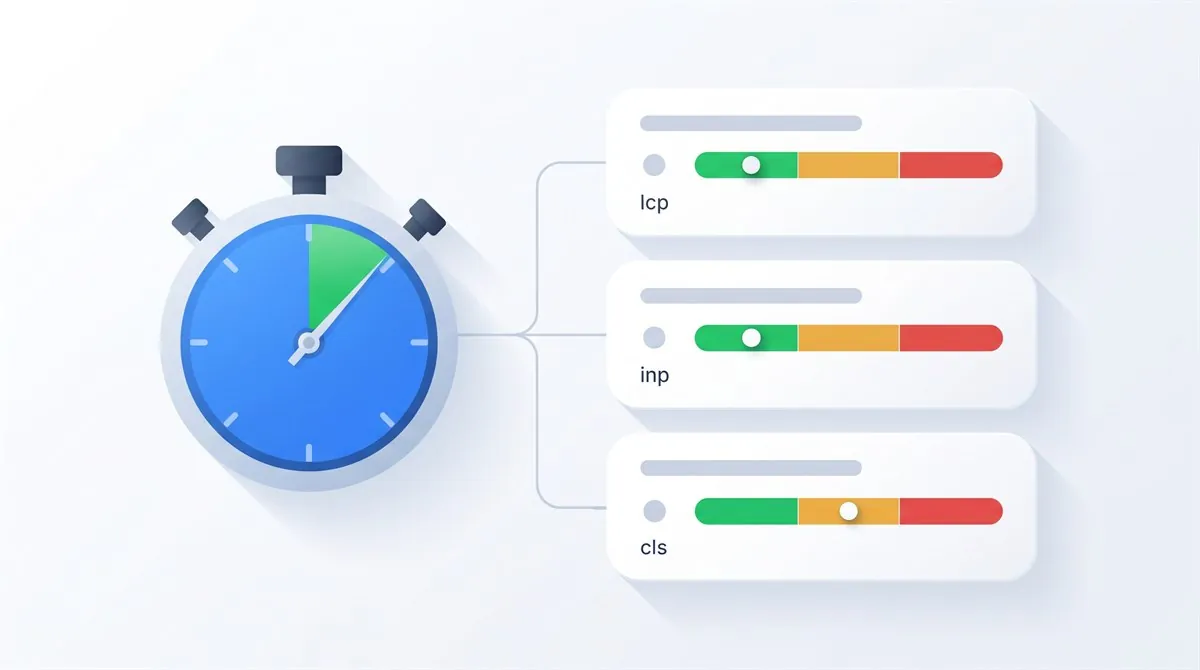
Core Web Vitals are Google's three measurements of real user experience: Largest Contentful Paint (LCP) for loading speed, Interaction to Next Paint (INP) for responsiveness, and Cumulative Layout Shift (CLS) for visual stability. A page passes when LCP stays within 2.5 seconds, INP at or under 200 milliseconds, and CLS at or under 0.1, all at the 75th percentile of real visits. They're measured from actual Chrome users, not from your test runs, which is exactly why so many sites think they pass while their visitors know otherwise.
I optimize these numbers for a living, and most Core Web Vitals confusion I meet isn't about code. It's about measurement: which number Google actually grades, why the lab score lies, and where the real data lives. So before the fixes, this guide spends real time on reading the instruments.
What Core Web Vitals Actually Are
Every visit to a page has three moments where the experience can fall apart, and each vital guards one of them:
It loads
The visitor waits for the main content to appear. LCP times this moment.
It holds still
Content settles without jumping as late elements arrive. CLS scores the jumping.
It responds
Taps and clicks produce visible feedback fast. INP times every interaction.
The definitions live in Google's web.dev documentation, which this guide quotes throughout. The set changed once: INP became a stable Core Web Vital on March 12, 2024, replacing First Input Delay, so any advice you read about "FID" predates the current rules.
The Three Metrics and Their Thresholds
| Metric | Measures | Good | Poor |
|---|---|---|---|
| LCP Largest Contentful Paint | Time until the largest visible element (hero image, headline block) is painted | ≤ 2.5 s | > 4 s |
| INP Interaction to Next Paint | Time from an interaction to the next visual frame, across the whole visit | ≤ 200 ms | > 500 ms |
| CLS Cumulative Layout Shift | How far visible content jumps around, as impact times distance, summed | ≤ 0.1 | > 0.25 |
Three details worth having straight:
- LCP has a specific candidate list. Per the LCP definition: images, video posters, CSS background images, and text blocks. In practice it's almost always your hero image or your headline, which is why LCP fixes are so targeted.
- INP watches everything. Not just the first click. Per the INP definition, it measures "the time from the start of the interaction to the moment the next frame is fully presented", for clicks, taps and keypresses through the page's whole life. One janky menu on an otherwise fast page can own your INP.
- CLS is a score, not a time. Each shift is scored as impact fraction times distance fraction (how much of the viewport moved, times how far), then summed per the CLS definition. That's why one full-width banner injection hurts more than ten tiny wiggles.
The 75th Percentile Rule (Why Your Fast Laptop Lies)
Google doesn't grade your average visit. Per web.dev, the assessment uses "the 75th percentile of page loads, segmented across mobile and desktop devices". Translated: line up all real visits from slowest to fastest, walk to the 75% mark, and that visit is your score. A quarter of your visitors experiencing something worse than 2.5 seconds means you fail LCP, even if the median visit is quick.
This single rule explains the most common conversation in performance work: "it's fast on my machine". Of course it is. You're on a warm cache, fiber, and a desktop CPU. The 75th percentile visitor is on a mid-range Android phone, on mobile data, seeing your site for the first time. That's the person Google measures you by, and the person your fixes have to serve.
Field vs Lab: The Two Kinds of Data (and the Score That Doesn't Count)
Every Core Web Vitals tool draws from one of two wells, and confusing them costs real money:
- Field data comes from the Chrome User Experience Report (CrUX): anonymized measurements from real Chrome users, aggregated, per Google's PageSpeed Insights documentation, "over the previous 28-day collection period". This is what Search Console reports and what matters for search.
- Lab data comes from Lighthouse simulating one page load on fixed hardware and network conditions. It's a diagnostic instrument: reproducible, detailed, and blind to what real users experience.
The trap: the big performance score at the top of PageSpeed Insights is lab-only. Google's own documentation is explicit that "having good lab data does not necessarily mean real-user experiences will also be good", and the reverse holds too. I've audited sites agonizing over a lab score of 82 while their field assessment passed comfortably, and sites celebrating a lab 98 while real users on real phones failed INP daily. Read the field section first, always. The lab score is for finding causes, not for judging outcomes. In a complete SEO audit, performance is one evidence stream beside crawlability, indexing, content and business impact.
Do Core Web Vitals Affect Rankings? An Honest Answer
Google's Search Central documentation puts it carefully: good Core Web Vitals align "with what our core ranking systems seek to reward". That's a real signal, and a deliberately modest phrasing. Vitals are not a rocket strapped to your rankings; they're one factor among many, and content relevance outweighs them every day of the week.
So here's the honest hierarchy. If your page isn't indexed, vitals are irrelevant (start with my indexing guide). If your content doesn't answer the query, vitals won't save it. But between comparable pages competing for the same intent, experience signals break ties, and more importantly: slow pages lose visitors before any ranking question arises. A visitor who bounces at second three of a five second load never sees your content, your form, or your phone number. That cost is immediate and shows up in revenue, whatever the algorithm thinks.
Fixing LCP: Make the Main Thing Arrive First
Find your LCP element first (PageSpeed Insights names it in the diagnostics). It's usually the hero image or headline. Then, in descending order of typical impact:
- Stop lazy-loading the hero.
loading="lazy"on the LCP image is the most common self-inflicted LCP wound I see. Lazy-load below the fold, never the top. - Tell the browser the hero matters.
fetchpriority="high"on the LCP image moves it up the download queue. The featured image on this very page uses it. - Shrink what you ship. Serve modern formats and honest dimensions. A 2 MB PNG scaled down by CSS is pure waste; this site's hero images are optimized JPEGs under 60 KB.
- Fix the server first if TTFB is slow. LCP includes the time before the first byte arrives. Caching, a CDN, or better hosting often beats any front-end trick.
- Unblock the render path. Defer non-critical JavaScript, keep critical CSS lean, and load fonts with
font-display: swapso text doesn't wait on font files.
<!-- above the fold: high priority, never lazy -->
<img src="/hero.jpg" width="1200" height="670" fetchpriority="high" alt="...">

<!-- below the fold: lazy is correct -->
<img src="/chart.jpg" width="640" height="357" loading="lazy" alt="...">
To see which of the four LCP phases is slow before choosing a fix, use the step-by-step LCP guide.
Fixing INP: Give the Main Thread Room to Breathe
For a reproducible example, trace-reading steps and a release checklist, use the guide to finding and fixing slow interactions.
Find the Slow Interaction Before Choosing a Fix
Write down the action that feels slow: opening the mobile menu, filtering products, submitting a form or selecting a tab. Reproduce it after the page has loaded and while normal third-party scripts are running. A page-load test alone does not exercise these actions.
- Start with available field data. Check whether the report describes the specific URL or the whole origin. If there is insufficient real-user data, say so; a lab result is not a replacement field pass.
- Record the interaction. Use Chrome DevTools' Performance panel to capture the actual click or keypress. Note the page, device conditions and action so someone else can repeat it.
- Find where time goes. Separate waiting before handlers run, time spent processing the event and the rendering work before the next visible frame.
- Change one cause and retest. Compare the same action under similar conditions, then review field data when enough new visits are available.
For example, a filter can update its selected state quickly but spend too long rebuilding the product grid. That calls for investigating the update and rendering work, not compressing an unrelated hero image. Google's INP optimization guide explains the input-delay, processing and presentation phases.
INP suffers when the browser's main thread is too busy running JavaScript to draw the next frame after a tap. The fixes are about doing less, later:
- Audit third-party scripts ruthlessly. Chat widgets, heatmaps, tag managers stuffed with forgotten pixels: each one competes with your visitor's tap. Remove what nobody uses; load the rest after the page is interactive.
- Break long tasks. Any script chunk running past 50 ms blocks every interaction that arrives during it. Split heavy work and yield to the browser between chunks so input can slip in.
- Respond first, compute second. On a click, paint the feedback (open the menu, toggle the state), then do the expensive part afterward. The visitor needs to see something happen within 200 ms; the bookkeeping can wait.
- Watch the DOM size. Rendering cost scales with complexity. Thousand-node pages recalculate slowly, and every interaction pays that tax.
INP is the vital most likely to need a developer rather than a plugin, because diagnosis may involve JavaScript scheduling, event handlers and rendering work rather than one page-load setting.
Fixing CLS: Reserve the Space Before It's Needed
Layout shift has one root cause: content arriving without space reserved for it. The fixes are mechanical and satisfying:
- Dimensions on every image and video.
widthandheightattributes let the browser reserve the box before the file arrives. Every image on this site carries them. - Reserve slots for ads, embeds and banners. Give the container a fixed size or
min-heightin CSS, and let the content fill it, not create it. - Never inject content above existing content. Cookie notices and promo bars belong at a fixed position or in pre-reserved space, not shoving the page down after load.
- Tame font swapping. A fallback font swapping to a web font with different proportions shifts every paragraph. Preload the font and pick a similar fallback.
<!-- the box exists before the image loads -->
<img src="/team.jpg" width="800" height="450" alt="...">

/* the ad slot holds its ground even while empty */
.ad-slot { min-height: 280px; }
Which Metric Is Your Problem?
Describe the symptom, get the diagnosis. Runs entirely in your browser.
Find the LCP element in PageSpeed Insights diagnostics, then work the list in the LCP section: un-lazy the hero, raise its fetch priority, shrink the file, check TTFB, unblock rendering.
The main thread is overloaded, almost always by JavaScript. Start with the INP section: cut third-party scripts, break long tasks, paint feedback before computing. Expect developer work, not a plugin toggle.
Something renders without reserved space. Run the CLS section: dimensions on all media, fixed slots for ads and banners, nothing injected above existing content, fonts preloaded.
Search Console and the PSI field section grade real users; the Lighthouse number simulates one artificial load. Google's docs are explicit that the two can disagree. Use lab findings to keep improving, but don't chase a 100 that no algorithm rewards.
Where to Check Your Numbers
- Search Console's Core Web Vitals report is the verdict that matters: field data, grouped into URL groups of similar pages, each group graded by its weakest metric. If you haven't set Search Console up yet, my walkthrough gets you there in an afternoon.
- PageSpeed Insights gives you both wells in one place: the field assessment up top (when CrUX has data for your URL), lab diagnostics below. Test your money pages individually, not just the homepage.
- Your own phone, on mobile data, is the cheapest field tool there is. Open your site somewhere with two bars of signal and tap around. The 75th percentile visitor lives closer to that experience than to your office wifi.
- TechSEO Inspector, my free Chrome extension, grades the page you're on against the same thresholds. One visit is a quick sample, not field data.
The Mistakes I Keep Finding on Audits
- Chasing the lab 100. Weeks spent squeezing Lighthouse points while the field data already passed. The score that counts is the one from real users; past green, further lab polishing is hobby, not SEO.
- Testing only on fast hardware. The site is judged at the 75th percentile of real visits, which means mid-range phones on mediocre networks. If you never test there, you're optimizing for an audience Google doesn't measure.
- Lazy-loading the hero image. A performance plugin set to lazy-load everything, including the one image LCP times. Instant self-sabotage, two-minute fix.
- Images without dimensions. The page assembles itself like a slow avalanche, and CLS collects the bill. Width and height attributes, everywhere, no exceptions.
- The third-party graveyard. Five years of marketing tools, three still in use, all still loading. Every forgotten pixel is a tax on INP.
- Fixing desktop while mobile fails. Assessments are segmented by device. The mobile assessment is usually the failing one, and usually the one with more traffic.
- Declaring victory the same week. Field data is a 28-day window; the report catches up gradually. Verify with lab tools now, confirm in Search Console next month.
The Core Web Vitals Checklist
Run this against your key pages today
- Field assessment checked in Search Console or PSI, mobile and desktop separately
- LCP element identified on each money page, not lazy-loaded, fetchpriority set
- Hero images compressed and served at honest dimensions
- TTFB sanity-checked; caching or CDN in place if the server is the bottleneck
- Width and height attributes on every image and video
- Ads, embeds and banners load into pre-reserved space
- Third-party scripts audited; unused ones removed, the rest deferred
- Fonts preloaded with font-display: swap and a close fallback
- Site tapped through on a real mid-range phone, on mobile data
- Reminder set to re-check the field report after the 28-day window turns over
Want Your Vitals Diagnosed, Not Just Measured?
Tools tell you which number is red. Finding the one script, image or template block causing it is the actual work. Core Web Vitals are one of the eight areas in my technical SEO audit ($255, 2-day delivery), which names what's failing, why and what to fix first. For a first look, my free review covers a small selection of your public pages, with up to five priority findings by email.
Request a free reviewCore Web Vitals: FAQ

I'm a developer who moved into technical SEO. I audit sites, then implement the fixes myself: indexing, Core Web Vitals, structured data, rendering. Performance work is where the developer half earns its keep, because the fix is usually in the code, not in a setting. Request a free website review and I'll take a look personally.