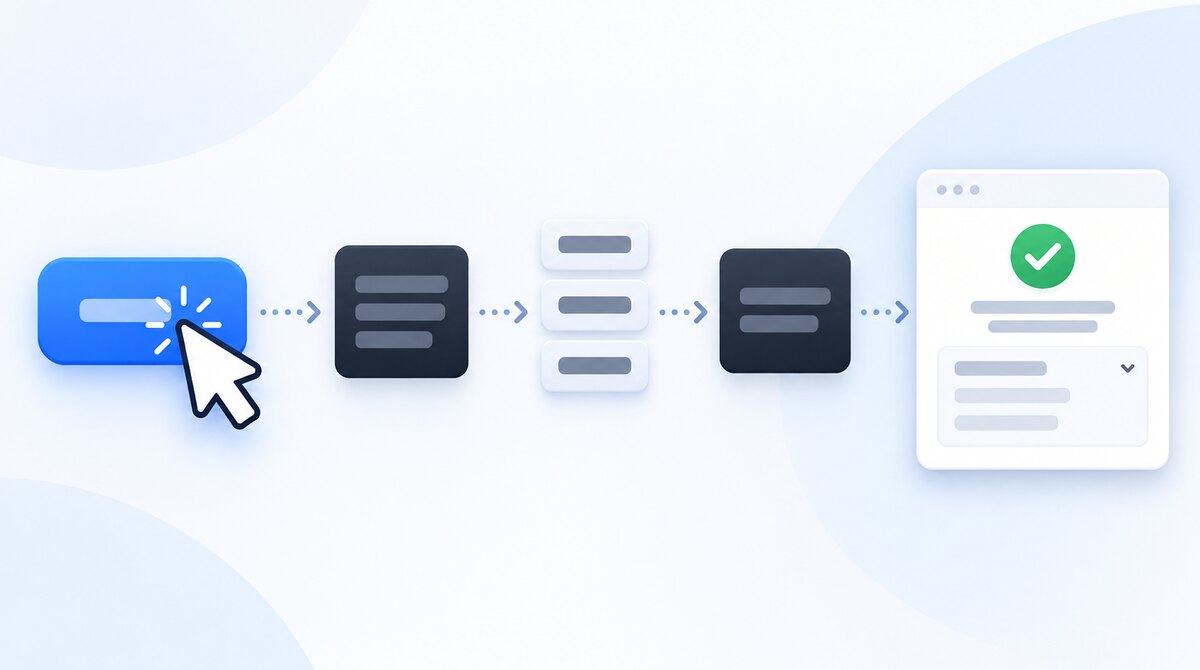
To improve INP, identify a slow interaction, record what blocks its next visual update, and reduce the work on that path. A smaller hero image might help loading, but it won’t necessarily fix a menu that freezes after a tap.
This guide is for site owners working with a developer and developers investigating a specific complaint. It includes a local teaching example you can record yourself. For LCP, CLS and the broader measurement picture, start with the Core Web Vitals guide.
What INP Measures
Interaction to Next Paint measures responsiveness to qualifying clicks, taps and keyboard interactions across a page visit. It includes the wait before an event handler runs, the handler’s processing and the wait for the next paint. Scrolling and hovering aren't qualifying interactions. The reported value reflects the slowest interaction, with some outliers excluded on visits with many interactions.
A good field INP is 200 milliseconds or less; above 500 milliseconds is poor. Assess the 75th percentile separately for mobile and desktop, rather than expecting every interaction on every device to meet one number. These definitions and thresholds come from Google's INP documentation.
INP isn't the time until a checkout payment finishes or a search request comes back. An interface can acknowledge an action promptly while waiting for the network. That acknowledgement must be honest: show “Submitting” while a request is pending, not “Order confirmed” before it succeeds.
Choose a Real Interaction to Investigate
Write down the page, action and conditions behind the complaint. “Mobile filtering freezes after selecting a size” is testable. “The website is slow” isn't specific enough to assign a fix.
- Try opening the main navigation immediately after arriving.
- Use a filter, select a product variant and add it to the cart.
- Type into search or a form with live validation.
- Test cookie preferences, expandable answers and chat controls.
- Repeat the action after the page has been open for a while.
Record whether it happens only on first use, only with a large result set, or only after a third-party widget loads. Save the exact steps so a second person can reproduce the same behavior.
Field data tells you whether real visitors have a problem; a local recording helps explain one instance. PageSpeed Insights can show CrUX data when available, while real-user monitoring can provide interaction-level context. Google's INP optimization guidance recommends connecting those two kinds of evidence. Missing field data is not proof of either good or poor responsiveness.
Record the Click in Chrome DevTools
- Open the affected page and Chrome DevTools. Select Performance.
- Record the browser version, device and any CPU or network throttling. Keep those settings the same when comparing changes.
- Start a runtime recording, perform the chosen action once, then stop.
- Find the interaction in the timeline and inspect the corresponding main-thread activity.
- Look for work before the handler, within the handler and before the visual update. Follow script locations into your code where possible.
- Save the trace with reproduction steps, then repeat to check that the result isn't a one-off.
Use the official runtime performance walkthrough for the panel controls. A runtime recording is useful here because a loading-only test may never open the menu or apply the filter that's causing trouble.
Keep the environment representative. An extension-free browser is helpful for isolating your code, but also test the actual consent state, widget combination and device class your visitors use. CPU throttling is a diagnostic approximation, not a substitute for checking a real phone.
Match the Fix to the Work You Found
| Where the delay occurs | What to inspect | A targeted experiment |
|---|---|---|
| Before the handler | Startup scripts, timers or other work already occupying the main thread. | Delay one nonessential widget on staging, then repeat the same action. |
| Inside the handler | Filtering, validation, repeated calculations or updating many elements. | Remove unnecessary work; split independent work into smaller tasks. |
| Before the next paint | Expensive layout or a large interface update after the handler. | Reduce the changed DOM and separate layout reads from writes. |
Inspect the trace instead of guessing from a function name. A short-looking UI function can trigger a lot of rendering work. For rendering problems, look for repeated style changes followed immediately by layout measurements. Batch measurements before updates where the behavior allows it. Chrome's layout performance guide explains why repeated read/write cycles can be expensive.
When the expensive work is calculation rather than DOM manipulation, a web worker may be worth considering. Workers can't directly update the page's DOM, and moving data between threads has a cost. First remove work that isn't needed at all.
A Copyable Example You Can Record
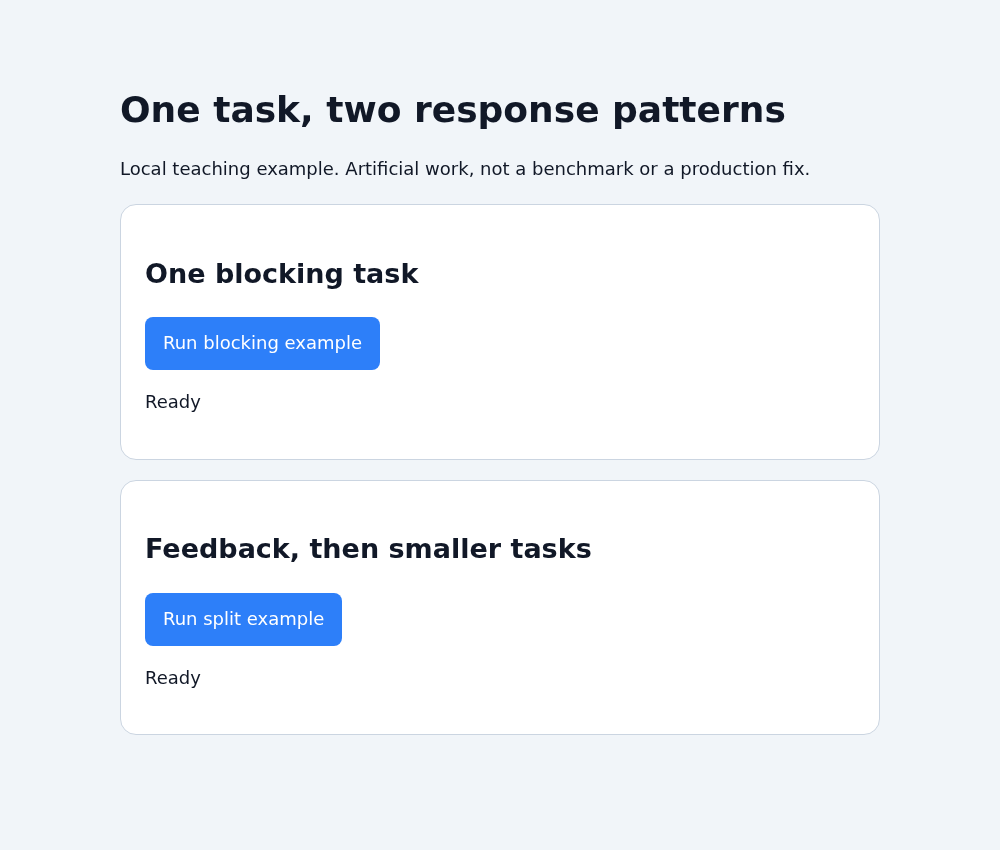
Save the following as a local HTML file and open it in Chrome. It deliberately wastes CPU time to make the difference easy to inspect. Never add the artificial work function to a production website.
The first button changes some text and immediately blocks the main thread. The browser cannot show that intermediate state while the task is running. The second gives feedback a chance to paint, then splits the same nominal amount of artificial work into smaller tasks.
<!doctype html>
<html lang="en">
<meta charset="utf-8">
<meta name="viewport" content="width=device-width,initial-scale=1">
<title>Responsiveness teaching demo</title>
<style>
body{font:18px/1.6 system-ui;max-width:760px;margin:40px auto;padding:24px;background:#f1f5f9;color:#111827}
section{background:white;border:1px solid #cbd5e1;border-radius:16px;padding:24px;margin:20px 0}
button{font:inherit;background:#2d7ff9;color:white;border:0;border-radius:8px;padding:12px 18px;cursor:pointer}
button:disabled{opacity:.65} h1{line-height:1.2}
</style>
<h1>One task, two response patterns</h1>
<p>Local teaching example. Artificial work, not a benchmark or a production fix.</p>
<section><h2>One blocking task</h2>
<button id="slow">Run blocking example</button>
<p id="slow-status" role="status">Ready</p></section>
<section><h2>Feedback, then smaller tasks</h2>
<button id="split">Run split example</button>
<p id="split-status" role="status">Ready</p></section>
<script>
function artificialWork(ms) {
  const start = performance.now();
  while (performance.now() - start < ms) {}
}
document.querySelector('#slow').addEventListener('click', event => {
  const button = event.currentTarget;
  const status = document.querySelector('#slow-status');
  button.disabled = true;
  status.textContent = 'Working...';
  artificialWork(400);
  status.textContent = 'Complete';
  button.disabled = false;
});
document.querySelector('#split').addEventListener('click', event => {
  const button = event.currentTarget;
  const status = document.querySelector('#split-status');
  button.disabled = true;
  status.textContent = 'Working...';
  requestAnimationFrame(() => {
    setTimeout(async () => {
      for (let chunk = 0; chunk < 50; chunk++) {
        artificialWork(8);
        await new Promise(resolve => setTimeout(resolve, 0));
      }
      status.textContent = 'Complete';
      button.disabled = false;
    }, 0);
  });
});
</script>
</html>
Record each button separately. Look for one long block versus repeated smaller blocks, and inspect when the feedback can appear. The split version can take longer to finish because scheduling adds overhead. Finishing sooner and responding sooner are different goals.
The example uses a rendering opportunity followed by a new task. Merely adding async to a function, or awaiting an already-resolved promise, doesn't move heavy synchronous work off the main thread. For real workloads, see Google's guide to breaking up long tasks, including yielding options and compatibility considerations.
Don't defer work required to validate a purchase, preserve data or display the correct result. Give useful pending feedback and keep failure handling intact. Splitting a loop also requires thinking about cancellation and stale results if the user changes their selection midway through.
Verify the Fix Without Overclaiming
Retest the same action before and after the change with matching settings and data. Then test adjacent actions: opening and closing the menu repeatedly, submitting invalid input, using the keyboard and navigating away during a pending operation.
- Did the relevant work disappear or move out of the interaction's critical path?
- Does the next visual update represent the real state?
- Can a second click, cancellation or failed request break the interface?
- Does the change help on a representative phone, not only your laptop?
- After release, does real-user evidence support the local result?
Keep the release date and the affected interaction in your change log. Field reports aggregate many visits; one fast local click does not prove the whole site's INP has improved. A better INP also doesn't guarantee higher rankings. The immediate objective is a usable interaction that doesn't leave people wondering whether their tap registered.
If the page is indexed but gets little search visibility, investigate relevance and search demand separately using the indexed-but-not-ranking checklist.
Frequently Asked Questions
Related Guides
- Understand all three Core Web Vitals.
- Put performance in a technical SEO plan.
- Investigate visibility after indexing.

I'm a developer who moved into technical SEO. I trace search problems through crawling, rendering, indexing, templates, content and performance, then implement the fixes instead of handing over a generic export. Request a free website review and I'll review your site personally.